

The biggest clues about AI’s impact on your job come from past technologies. This article uncovers the economic forces that determined who lost work—and who gained—from previous efficiency breakthroughs, from farming to software development.

In my recent articles “MIT’s Project Iceberg Reveals AI’s Job Impact Is Far Bigger Than It Appears” and “The Canary in the Code Mine: What Tech’s Job Slump Means for the Rest of Us” I’ve repeatedly discussed AI-driven job loss. However, that job loss isn’t universal, and there are subtleties as to why some industries will be more impacted than others. Physical therapists and store shelf stockers are less at risk from LLMs than claims adjusters and software coders. But equally important are the economics of specific jobs and industries.
Cynical readers of my articles and listeners of my talks believe companies will use AI to lay off as many people as possible. The reality is more varied. Whether a company will use AI for cost savings or revenue growth depends on how a specific role impacts costs, revenue, and margins; ultimately it comes down to how elastic demand is for the output of that role as it becomes more efficient.
To understand the factors in Part 1 we’ll examine the impact of technological change in past industries. Looking at different cases can help us isolate why technology improvements for a specific job destroyed some jobs in the past while in other cases it increased the number of jobs (not new types of jobs but the specific job it made more efficient). In "How to Know If Your Job Is Safe from AI — Part 2: The Economic Drivers of Your Job" we’ll then apply these concepts to roles today to understand who is most at risk and provide a framework by which you can assess your own job’s risk.
In 1800, 83% of the US workforce was in agriculture. The industrial revolution had just begun a few decades earlier, really gaining steam (no pun intended) in the nineteenth century. One hundred years later, in 1900, the proportion of the US workforce in agriculture was now only 30% (that’s technically the number of people living on farms, not working on farms, but the two have a close correlation). Keep in mind that the US population grew from roughly 5 million to 76 million people over that period.
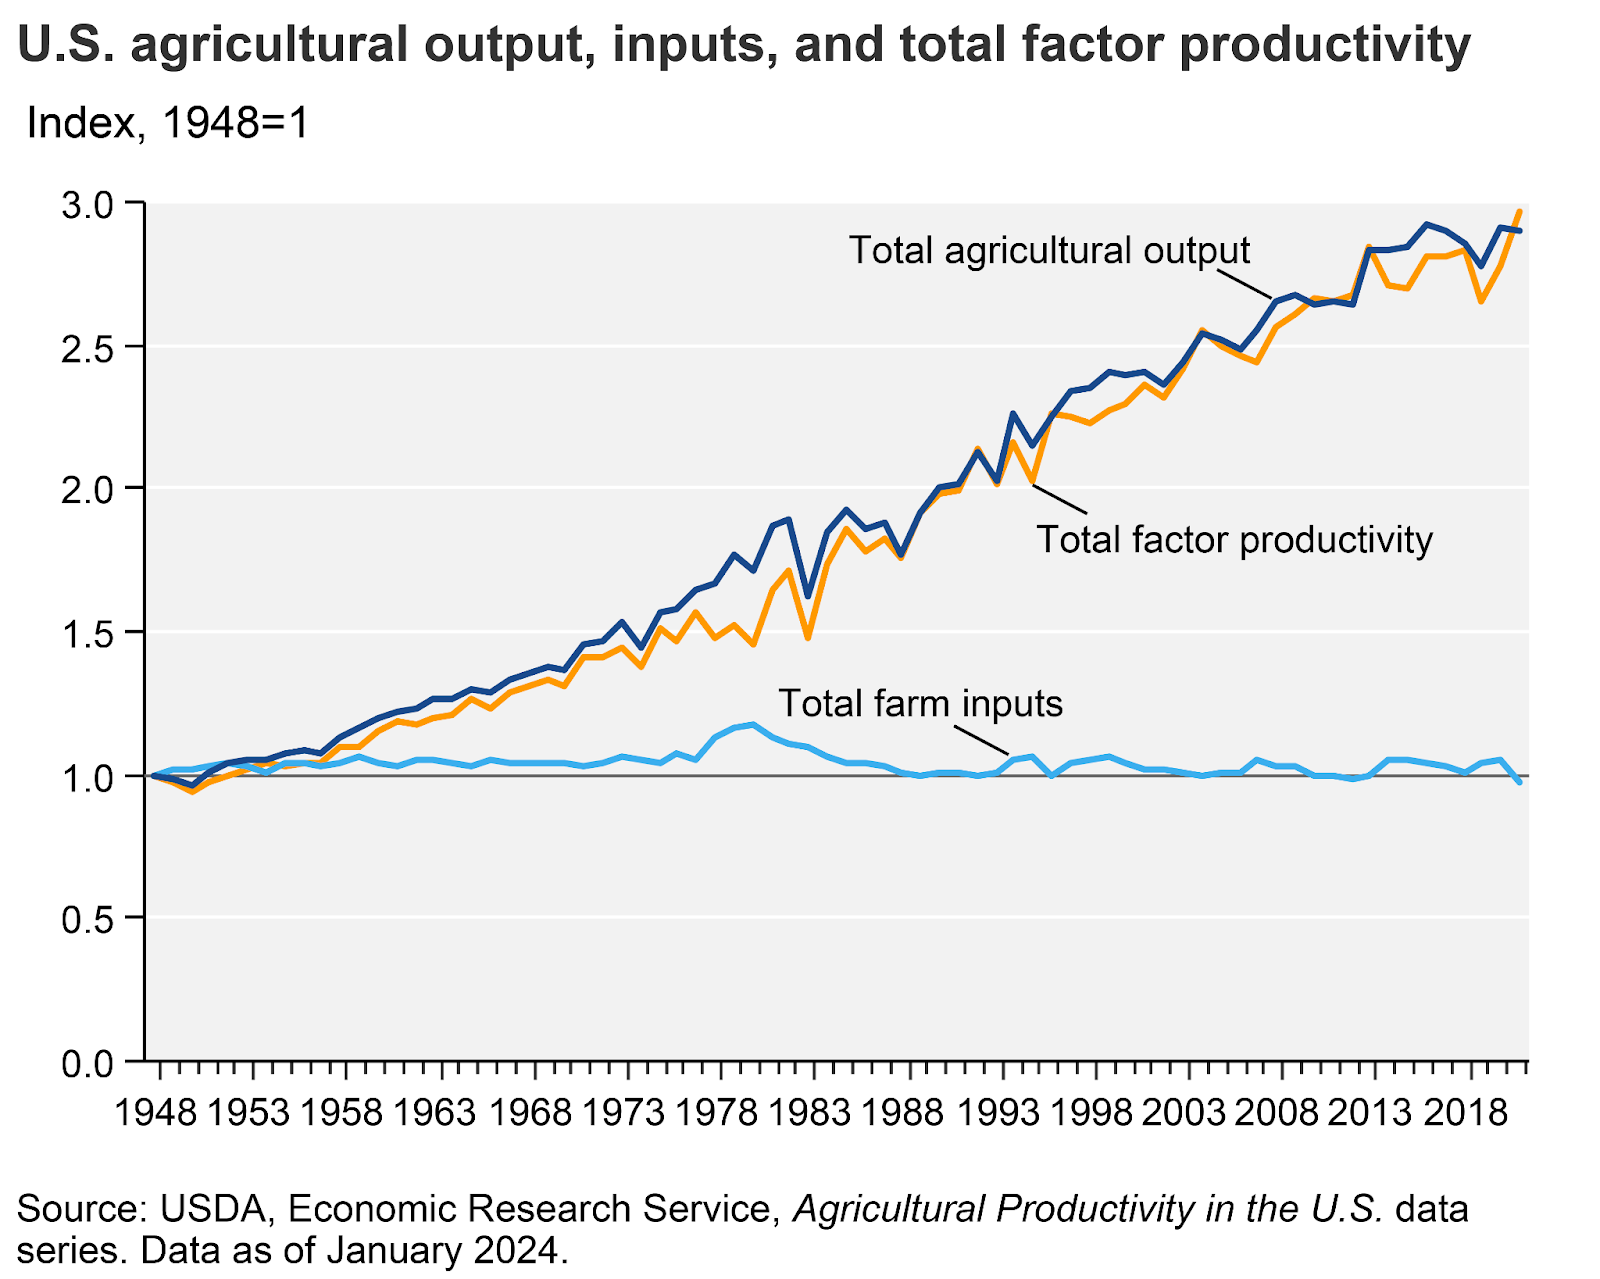
These trends continued into the twentieth century; a recent USDA Economics Research Service report (updated Aug. 29, 2025; accessed Dec. 6, 2025) noted, “Innovations in animal and crop genetics, chemicals, equipment, and farm organization have enabled continuing output growth without adding much to inputs. As a result, even as the amount of land, labor, and other inputs used in farming declined, total farm output nearly tripled between 1948 and 2021.” Today, in 2025, there are only 3.4 million farmers (accessed Dec. 6, 2025) supporting a population of 340 million Americans.
History rhymed a century later as US manufacturing declined. In the BLS Data August 2016 Current Employment Statistics survey: 100 years of employment, hours, and earnings (accessed Dec. 8, 2025) manufacturing post WWII grew at 16% from 1945-1972 and even 7% until 1979. After that it declined 9% and then 28% in the 22- and 14-year periods respectively.
University of Wisconsin Stevens Point Professor Kevin Bahr in his 2025 article “U.S. Manufacturing Employment: A Long-Term Perspective” (accessed Dec. 8, 2025) noted that manufacturing in the US peaked in 1943 at 38.9%. While that peak was partially due to the war, by the early 1980s the number was down to only 21% of the labor force and by the end of 2024 it was down to 8%. He cites in his article the following FRED (Federal Reserve Bank of St. Louis) chart.
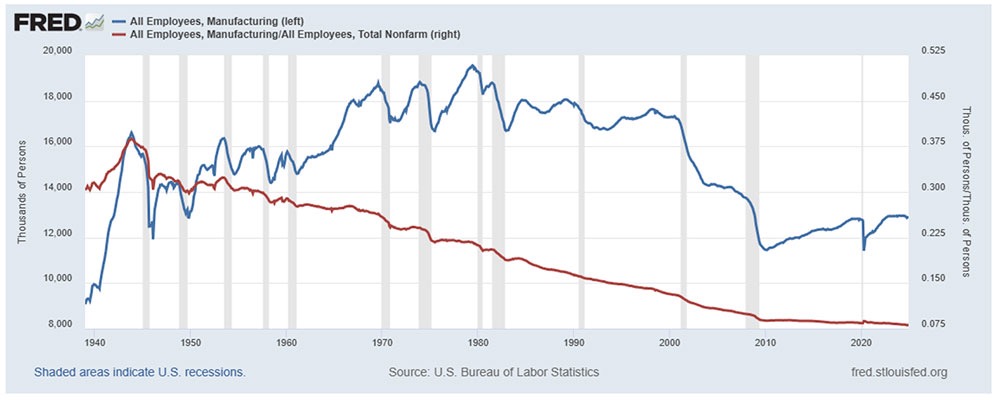
During the past forty or so years, politicians and voters alike blamed outsourcing and globalization. In reality, 87% of the manufacturing jobs lost stemmed from technology improvements, not geopolitics or trade.
In both these cases, farming and manufacturing, jobs were simply lost. The reason is because there were limits to demand for the products they created. People can only eat so much food. Even with the growing US population, because the pace of food productivity was faster, the overall percentage of jobs decreased. Yes, we do import food (as well as export), and plenty of Americans starved, but that was generally not due to lack of food but lack of economic alignment and infrastructure. There's only so much food Americans can eat; given that cap, increased productivity led to decreased headcount.
Likewise, with manufacturing, Americans can only buy so many cars, TVs, and widgets. Yes, lower prices will drive some demand. Cars went from a luxury item only rich families could afford a hundred years ago to the modern two-car family American today. That’s due to efficiency improvements reducing the cost of the car. But if all cars halved in price, families wouldn’t suddenly move from having two cars to four cars. In the end, once demand was largely met, efficiency led to fewer workers being needed.
The reason families won’t suddenly double their car ownership is because demand for cars is relatively economically inelastic; even when producing them is more efficient it doesn’t lead to new uses of cars, creating new demand. Quite simply, people don’t get much additional benefit from extra cars (not to mention that many homes only have a two-car garage).
In 1865, economist William Stanley Jevons looked at the question of what happens when demand is elastic. Specifically, he looked at The Coal Question; that was the name of his book in which he considered demand for coal in light of the Watt steam engine.
Initially, one might think that the efficiency improvements in the steam engine would mean there’s less need for coal since each engine now needed less coal for the same level of operation. In fact, efficiency reduced the cost per unit of power, which made steam engines viable in many more industries. That expansion of uses created new buyers and new applications, so total demand for coal rose, not just as a simple adjustment along the old demand curve. Jevons wrote of this in his book, “It is a confusion of ideas to suppose that the economical use of fuel is equivalent to diminished consumption. The very contrary is the truth.” The new demand outpaced the decreased need from older factories resulting in net increased demand. This is now referred to as Jevons Paradox (surprisingly, without an apostrophe at the end of his name).
We’ve seen modern examples of this. As the cost of travel has dropped, from more gas efficient automobiles to the lower cost of air travel, demand for travel increased. Reservoirs, designed to reduce the risk of water shortages, have led to increased water usage, as it’s now readily and stably available.
Note that this is different from simply moving the crossing point of supply and demand as you may have learned in econ 101. It’s not simply that the lower price causes more of it to be bought; rather, efficiency unlocks new applications and industries, which shifts the demand curve outward and leads to a net increase in total demand. (See “Shift of the Demand & Supply Curves vs. Movement along the Demand & Supply Curves” for a more detailed discussion.)
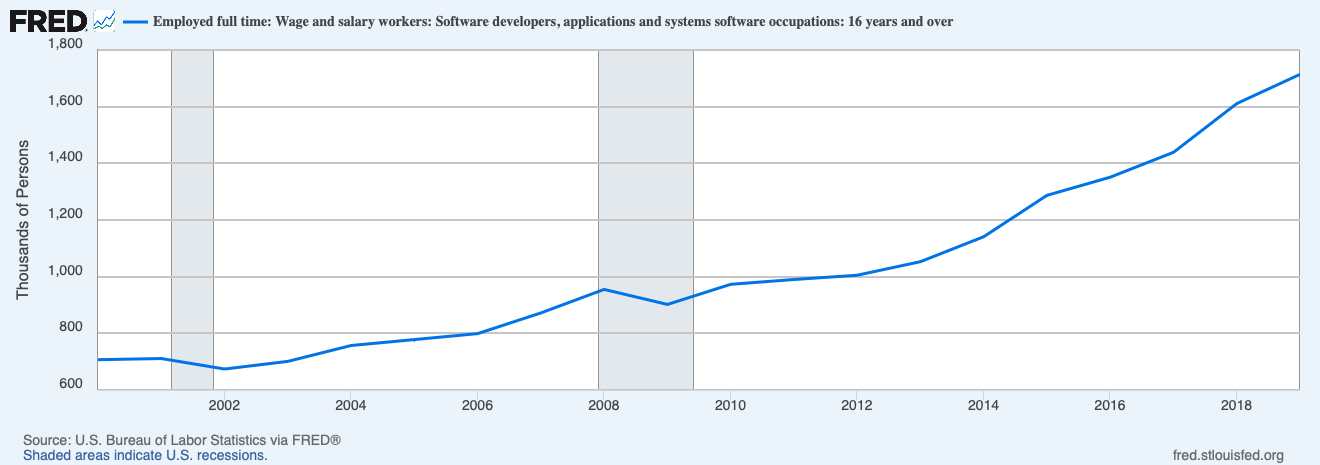
We saw this pattern of Jevons Paradox in software development (although notably not website development) as we’ll discuss below. Through improved software languages and frameworks, open-source libraries, cloud services, and third-party tools (e.g., processing credit cards on a website can be set up in minutes using third-party web services), the cost of software development has come down. FRED data on software developers shows the number of software developers growing from 700,000 to 1.7 million over 19 years.
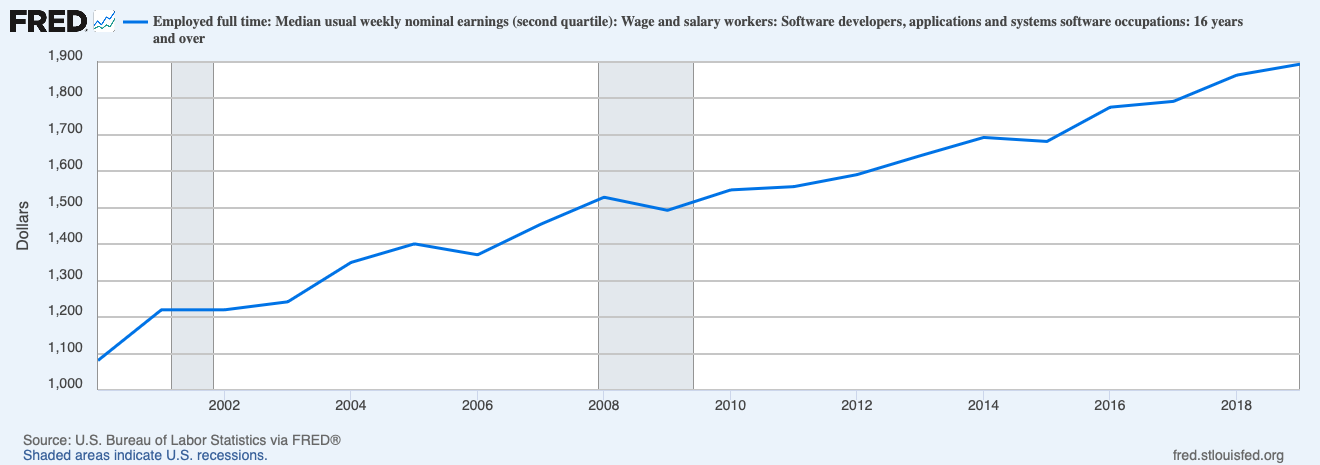
During the same period, we saw wages increase 83% as shown in the chart below. Inflation averaged 2.1% during the same period for a net increase of 48.5%. In other words, wages grew (in real dollars) even as the number of workers increased. This is because demand for talent outpaced supply.
If anything, this underreports the true numbers. Between 2000 and 2019 the amount of software outsourced from the US increased significantly. I have not been able to find reliable data so I’m basing this on my own experiences working in the field of software. While there was some outsourcing in the 1990s, primarily to India, it expanded significantly post 2000. India itself grew the number of software developers and expanded its infrastructure. The growth of the web and related services allowed for easier document sharing, code sharing, project management tools, and communication. Consider what it was like to do a VOIP call in 2000 versus in 2019. In addition to India and Pakistan, Eastern Europe (and Russia before the war) grew its software services capacity significantly, and more recently Latin America. Again, even with the increased supply of developers, wages grew significantly for software developers in the US.
The reason is Jevons Paradox. A $60M software project may not be viable for a company. But with efficiency gains that project may now only cost $5M and so it gets the greenlight. The lower costs created increased demand. As with the increased demand for steam engines, the lower prices created more projects. The increased demand for software development outpaced supply, even with better tools and more workers entering the labor force. This resulted in a wage increase (at least through 2022).
I noted above that it did not hold true for website development. In fact, many websites are now often built by developers in Asia at a rate of $10-30/hr. Again, technology has improved the productivity of web developers. There are website builder services letting you drag and drop, requiring no technical know-how. Why didn’t Jevons Paradox apply here? Because, like cars, there’s a cap on website demand.
I’d argue (as a CTO who has led teams the past twenty years) that between 1995 and 2025 we’ve seen roughly a 30x improvement in development of software and websites. I noted that we now greenlight new projects due to the reduced cost. But were there websites we held back on due to cost? A company generally only has one website. Sure, some websites are now bigger or more robust. Maybe some companies have secondary websites. In addition to the website for my book The Career Toolkit: Essential Skills for Success That No One Taught You I created a second, independent website for the free Brain Bump app; I wouldn't have done that years ago when the second site would have cost me thousands of dollars per website. We’re definitely not seeing a 30x demand for websites. Consequently, the wages for website development have fallen. The drop comes from capped demand, and an increase both in the number of developers (the increased global supply of such web developers), and tooling efficiency. In other words, website development looks more like cars than coal: efficiency rose, but demand was effectively capped, so workers absorbed the impact.
What we’ve seen above are different types of impact an innovation can have. Technological improvements eliminated jobs in farming and manufacturing. With software, it increased demand, creating more jobs for software development, while simultaneously dropping wages for web development.
More generally, capped demand for goods like food and cars means productivity improvements will lead to job loss in those fields. When there’s elastic demand, as we saw with software, Jevons Paradox can lead to increased demand and potentially more jobs. While there are theoretical limits to anything, what matters is whether the current productivity shift hits that limit or not.
In “How to Know If Your Job Is Safe from AI — Part 2: The Economic Drivers of Your Job” we’ll dive into three categories into which jobs may fall: cost-center jobs, revenue-expanding jobs, and demand-limited jobs. Once we understand what factors drive each of them, readers can start to predict what may happen to their specific role.


It’s critical to learn about corporate culture before you accept a job offer but it can be awkward to raise such questions. Learn what to ask and how to ask it to avoid landing yourself in a bad situation.


Investing just a few hours per year will help you focus and advance in your career.

Groups with a high barrier to entry and high trust are often the most valuable groups to join.


